
5 lesser-known Chrome features for web developers
Do you want to know how a few lesser-known Chrome features can improve your workflow as a developer? Enrichen your Chrome DevTools knowledge and code like there’s no tomorrow.
As a young web developer, I know how important it is to learn about and experiment with the latest tools and features available. That's why I'm excited to write about these perhaps neglected Chrome features that have greatly improved my workflow and productivity. I hope that by sharing my experiences and insights, I can help other developers, both seasoned and beginners, so they can make the most of these “hidden Chrome gems” and optimize their own web development process.
The Chrome browser and DevTools have been widely used and continuously improved over the years, and this article was written in 2023 to provide you with the most current information. Now, let us introduce you to these overlooked features, which will surely give you some new and exciting ideas!
Feature 1: Design mode
One common task for developers is to inspect an element on a web page and modify its HTML to preview changes or test the effects of different modifications. However, directly manipulating HTML within DevTools can be a frustrating experience. Sifting through tag soup, locating opening and closing brackets, and dealing with excessive whitespace while editing text can be tedious, particularly for designers who don't want to deal with that mess.
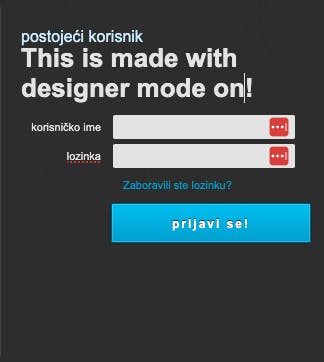
Furthermore, complex websites often have deeply nested HTML and mysterious CSS classes, making the DevTools experience suboptimal. Fortunately, there is a feature called Design Mode that can alleviate some of these issues. Although it isn't the default setting and activating it can be a hassle, it allows users to make live, visual changes to a page, similar to editing a spreadsheet or working in the text editor.
By following a few simple instructions, anyone can activate this feature and begin making quick edits without the trouble of dealing with HTML directly. While it may not present a complete solution to all design challenges, if the feature is crowd-pleasing, it's possible that more powerful editing possibilities will be added in the future.
Instructions:
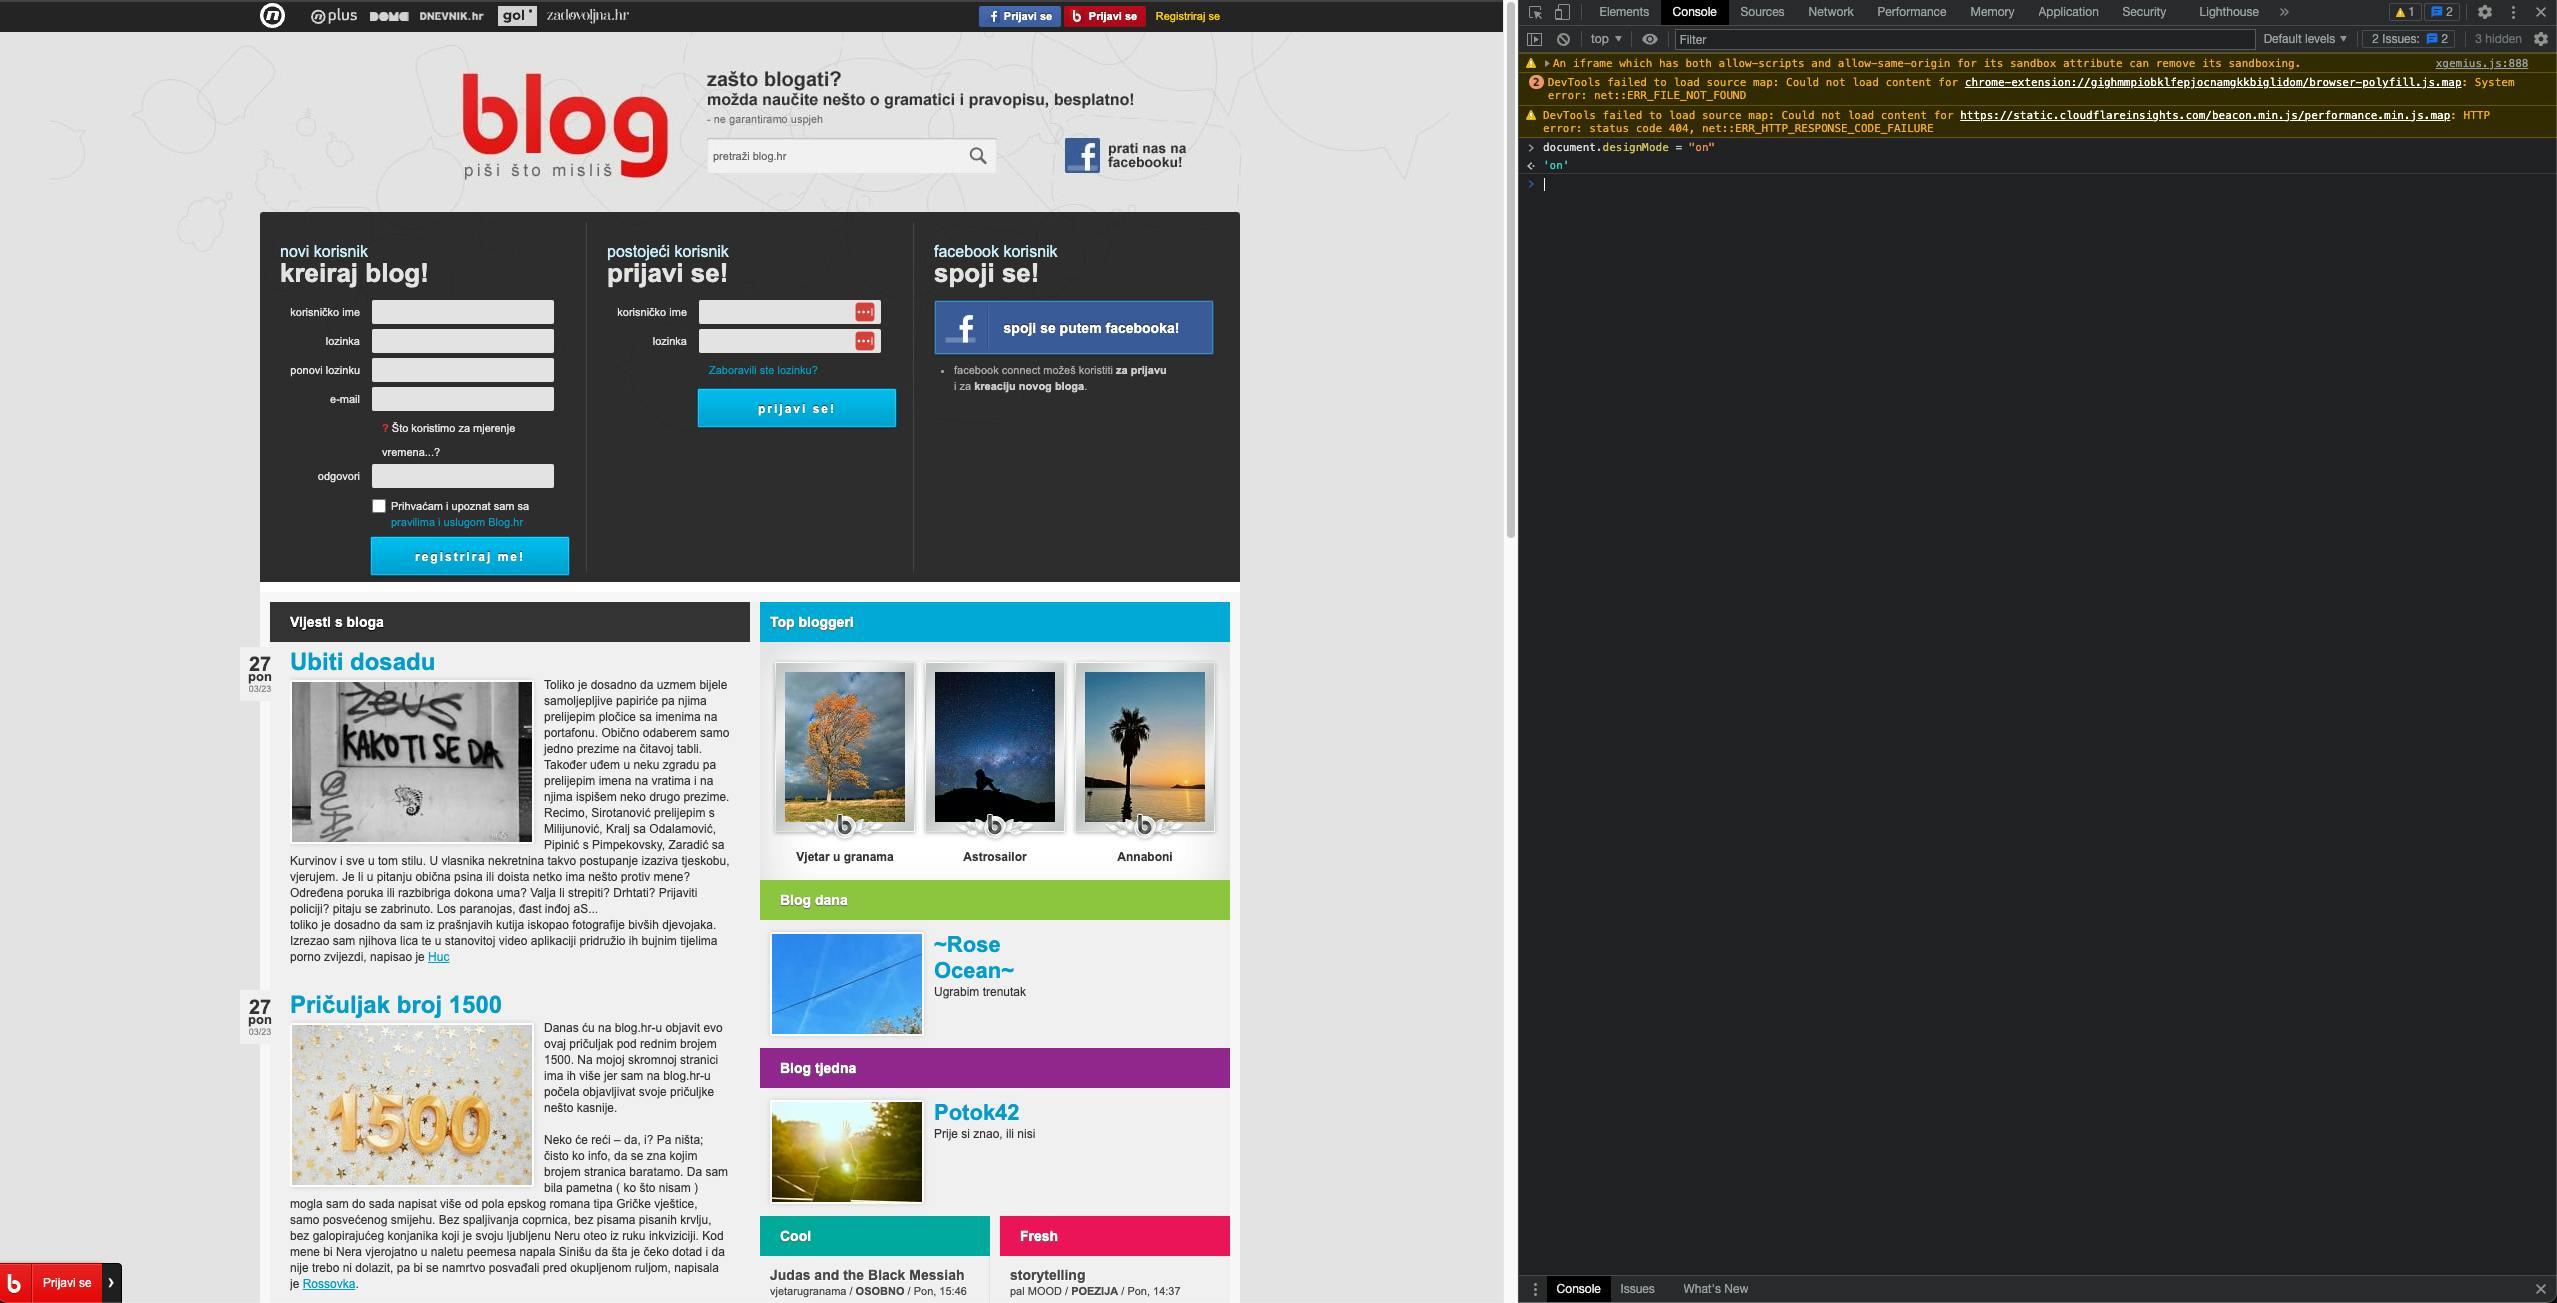
To activate Design Mode, simply follow these easy steps. Firstly, make sure that the web page you wish to edit is loaded and currently displayed (i.e., the tab is active). Next, open the DevTools panel in your preferred fashion, whether by a keyboard shortcut, mouse click, or another method. Once the DevTools panel is open, navigate to the "Console" tab. While some may find following these instructions as easy as making a pie, it's important to consider those who may struggle with these features.
Once in the "Console" tab, click on the first line next to the cursor, which will trigger a typing prompt, and you can begin typing JavaScript code (as seen in the screenshot below). Don't be intimidated by this; it's a straightforward process. All you need to type is "document.designMode = 'on'". You can also copy and paste the code from this page (making sure to remove any formatting) or type it manually. Finally, hit Enter/Return to activate the Design Mode, and you're ready to make visual changes to the web page.
Feature 2: Logpoints
As developers, logging various parts of our code to the console is an essential task we do frequently. The reasons for logging are numerous, making it a challenging process to eliminate. Consequently, we must seek a more efficient logging method. In this article, we will discuss and demonstrate the use of the Logpoints feature to declutter your codebase by reducing the need for multiple console.log() calls.
In essence, Logpoints is a tool that allows you to log messages to the console without cluttering your code with numerous console.log() calls. Logpoints is not a replacement for console.log(); instead, it offers a smarter alternative for logging messages to the console.
When you enter the DevTool interface:
1. First, you need to open a file in the Sources panel. A fast way to do that when you know the file name is to press Control-O or Command-O on Mac, type the file name, then press Enter.
2. To add a logpoint, right-click a line number and select Add Logpoint.
3. In the breakpoint editor, type the expression that you want to log in to the console, in this case {app}.
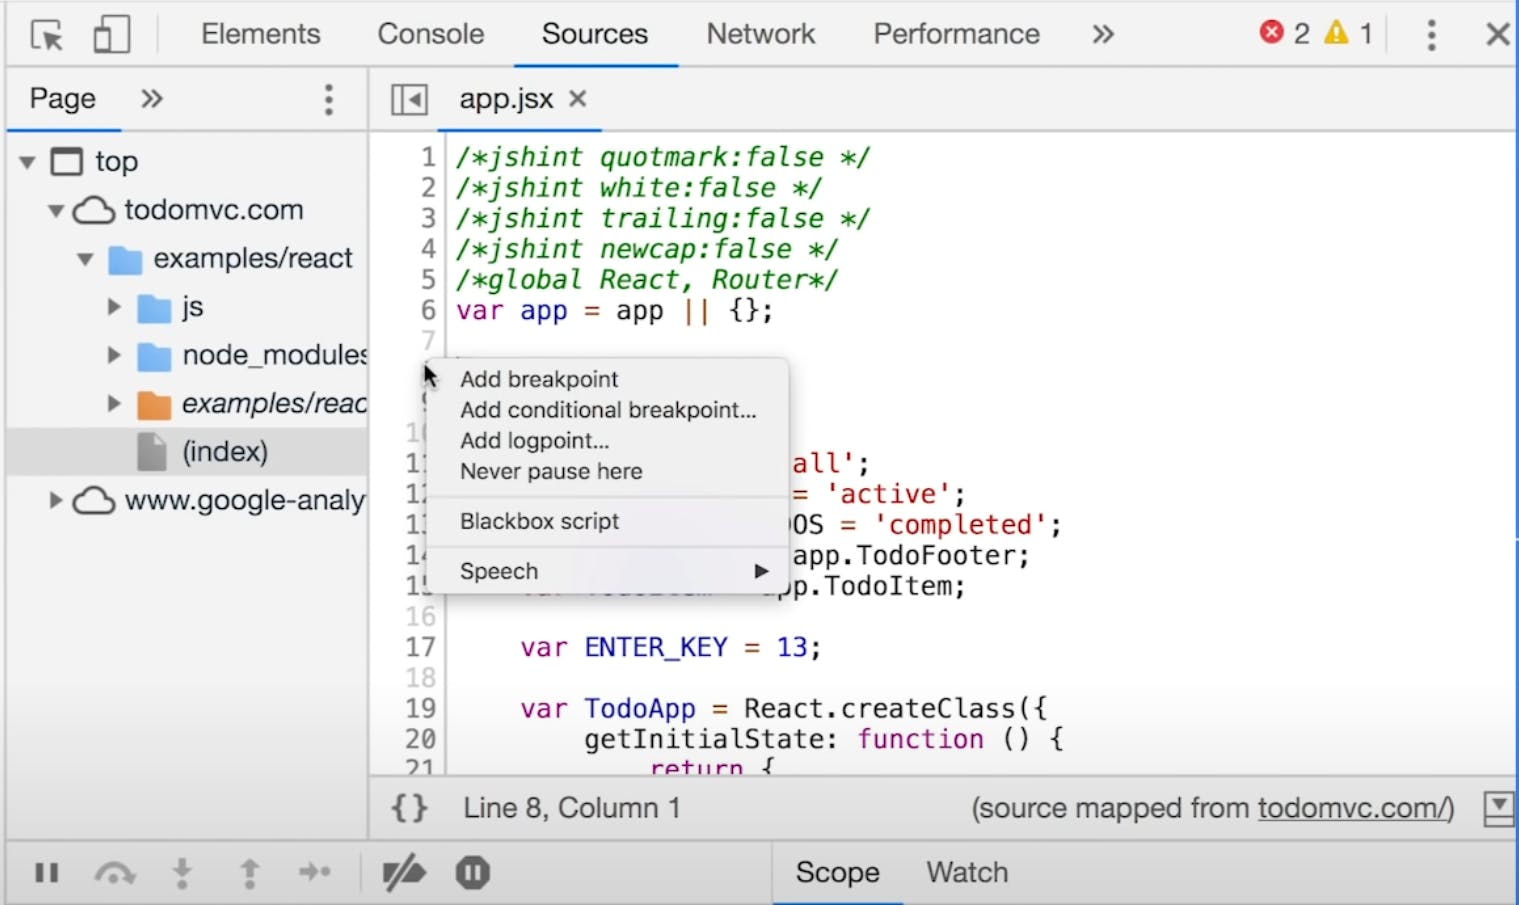
4. When your expression is ready, press Enter to save it. The next time that the code runs, the result of the logpoint is logged to the console.
5. Then, press Escape so that you can see the console directly. In this case, you need to reload the page in order for this code to run.
6. As expected, the expression has been logged to the console!

7. To temporarily deactivate the logpoint, hold Shift and then click it.
8. To delete a logpoint, just give it a regular click.
In conclusion, Logpoints in Chrome DevTools is a powerful feature that enhances the logging process for developers. By minimizing code congestion and offering a smarter alternative to traditional console.log() calls, Logpoints streamlines the debugging experience and optimizes code readability. Embracing this innovative functionality will undoubtedly lead to a more efficient and cleaner development process.
Feature 3: Interactive color picker
We all know that inspecting DOM elements in DevTools is a common task for web developers. It allows us to view and edit the CSS details and see the changes immediately. However, there is a hidden convenience in the DevTools that many developers may not know about.
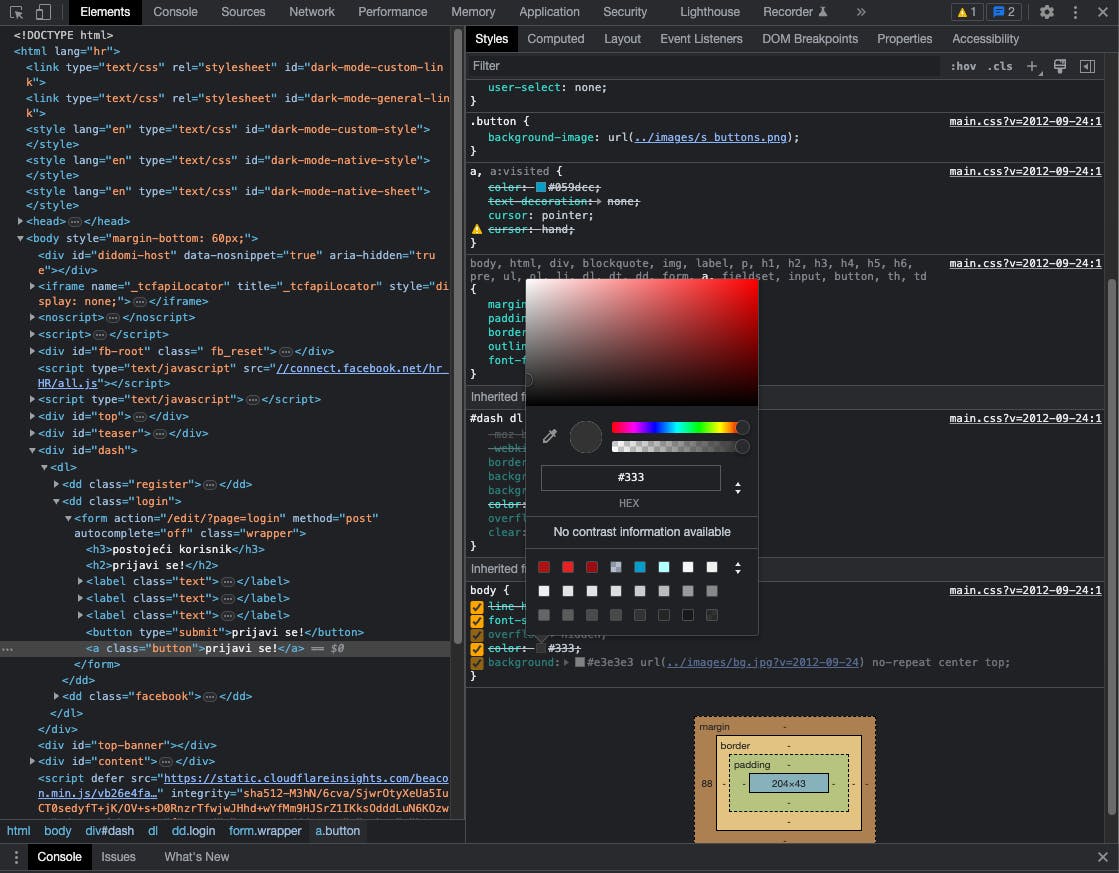
When you click on a CSS color property, a color picker interface will pop up, offering various options to control transparency, change color systems, pick colors from the page, and more. With this feature, experimenting with accent colors or designing websites directly in the browser is much easier and more efficient.
Accessing and identifying the color on a web page or design using Chrome DevTools can be a little confusing for beginners. By default, the "Style" section should be active at the bottom of the DevTools, but if you have something else selected, make sure to click on "Style" to access the CSS code of the web page. Once you're there, scroll down through the CSS code until you find a color box labeled as background or color under the body section. Clicking on the color box will give you more options, as shown in the screenshot below, including the hex code or RGB value of the color, which can help you select other CSS elements to explore and inspect the design on the web page.
Feature 4: Snippets
In the ever-evolving world of software development, efficiency and productivity are the keys to success. Enter Dev Tool Snippets, a valuable addition to any developer's arsenal. These customizable, reusable code blocks offer a versatile solution for streamlining daily tasks, enhancing the development experience, and reducing time spent on repetitive actions.
Dev Tool Snippets are basically miniature scripts that can be created, saved, and executed within browser development tools, such as Google Chrome's Developer Tools or Mozilla Firefox's Web Console. These handy tools are designed to help developers test, debug, and optimize their code in real time, allowing for rapid iteration and streamlined workflows.
Whether you are a seasoned expert or a beginner seeking new ways to improve your craft, Dev Tool Snippets is an indispensable resource for every developer's toolkit.
Throughout this blog post, we will showcase a snippet example that outputs the CSS colors applied to elements within a webpage.
When you enter the DevTools interface:
1. Access the Sources section.
2. Navigate to the Snippets tab.
3. Either select the "+ New snippet" option or right-click within the Navigator space and choose "Create new snippet".
4. Feel free to name the snippet as you wish; for our example, we will name it "allColors."
5. Locate the code at the provided GitHub link and copy it to incorporate into your "allColors" snippet: https://github.com/bgrins/devtools-snippets/blob/master/snippets/allcolors/allcolors.js
6. Save your code and execute the snippet either by right-clicking on the snippet and selecting "Run" or by using the keyboard shortcuts Control+Shift+P (Windows/Linux) or Command+Shift+P (Mac) to open the Command Menu. Remove the '>' and type '!' to display your available snippets, then click on the desired snippet to initiate its execution.
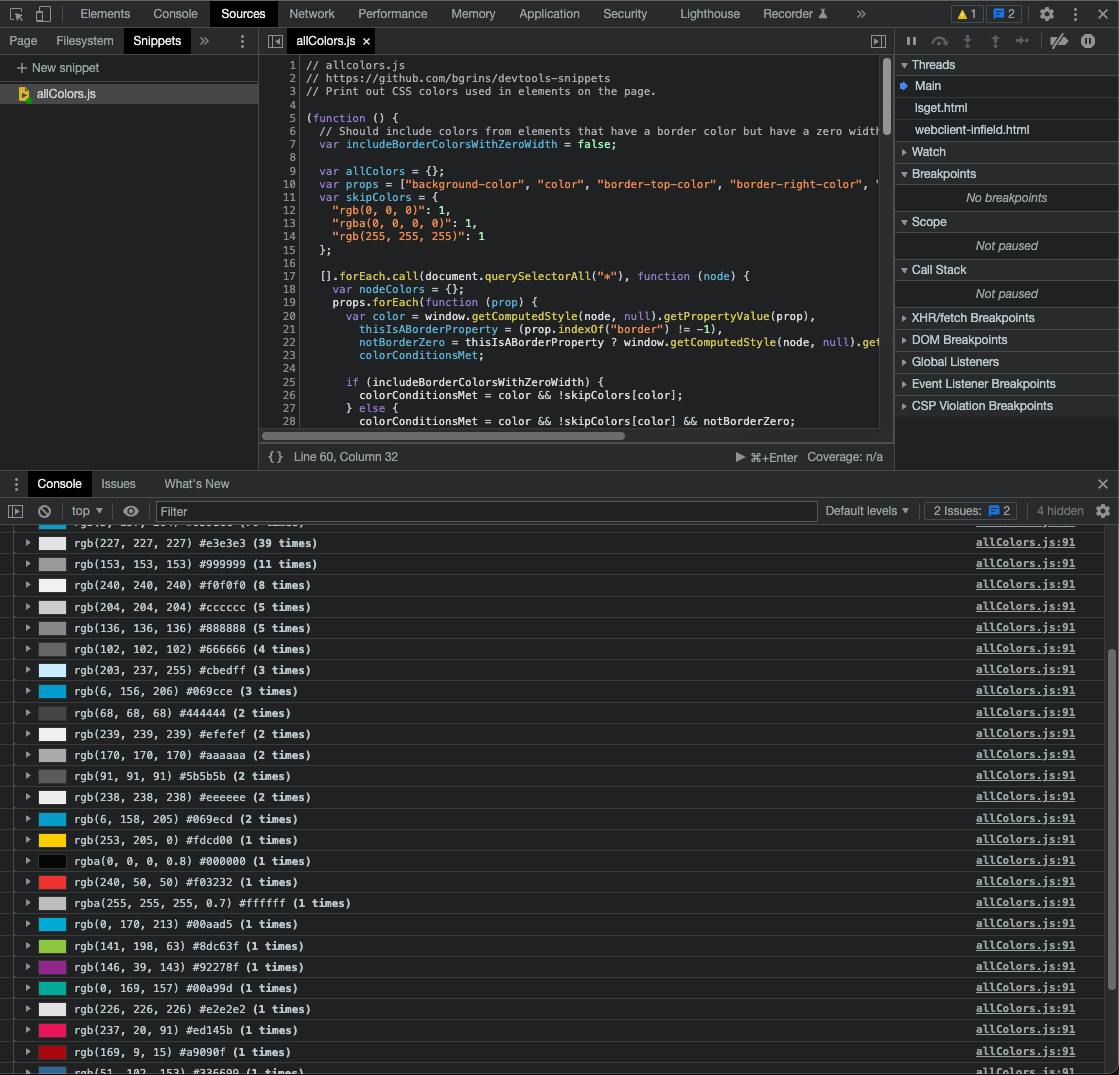
Here are a few useful snippet examples, along with brief descriptions of their functions and the corresponding GitHub code links:
1. Document info:
Logs the page <title>
Logs the page description
Logs the defined natural language
https://github.com/matuzo/DevToolsSnippets/tree/main/documentinfo
2. Debug images:
Lists images without width and/or height attributes
Lists images with empty alt attributes
Lists images with suspicious alt attributes
https://github.com/matuzo/DevToolsSnippets/tree/main/debugimages
3. Remove CSS:
Removes all <link>s to CSS files
Removes all style elements
Removes all style attributes
https://github.com/matuzo/DevToolsSnippets/tree/main/removecss
Feature 5: Website performance reports
Nowadays, website performance plays a significant role in determining the success of a website or business. Even a slight improvement in performance can lead to significant SEO gains and enhanced user experience. However, identifying the areas that require improvement and those that don't can be challenging.
Do you have to hire a team of experts and wait for days to find out?
Fortunately, Chrome DevTools has made it easier for everyone. In the latest Chrome versions (as of late 2020), you can access the Lighthouse tab in DevTools. Earlier, it was known as Audits, which might be confusing to find in the official documentation. Lighthouse was previously a well-known website that provided free performance reports. However, Google removed it for undisclosed reasons, and the same powerful functionality re-emerged later in DevTools.
Generating a performance report is now more convenient than ever. Once the page has loaded, all you have to do is click a single button:
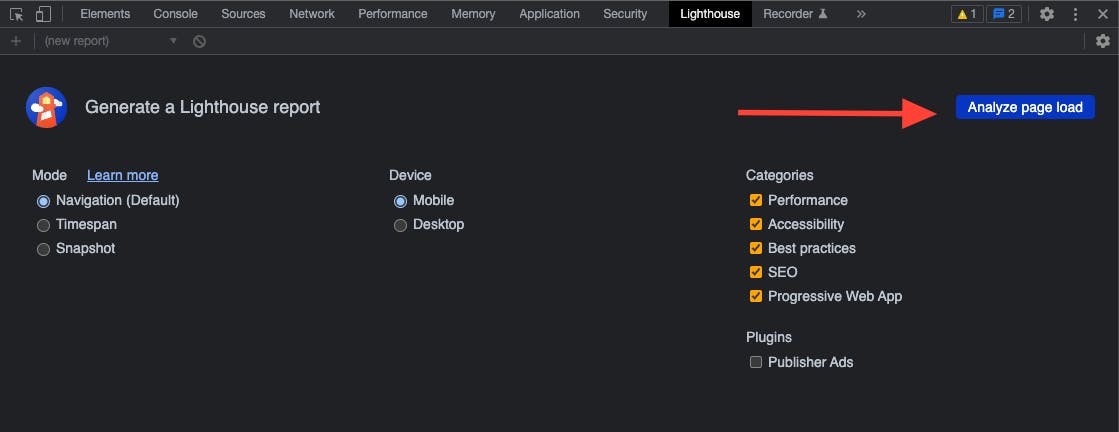
In the DevTools, you can customize and control how much information you want to test for on your website's performance. Once you've selected your preferred options, hit the blue button and wait for a few seconds. Your report will appear on the right side of the DevTools and will include valuable insights into your website's performance.
Here is an example of what the report might look like:
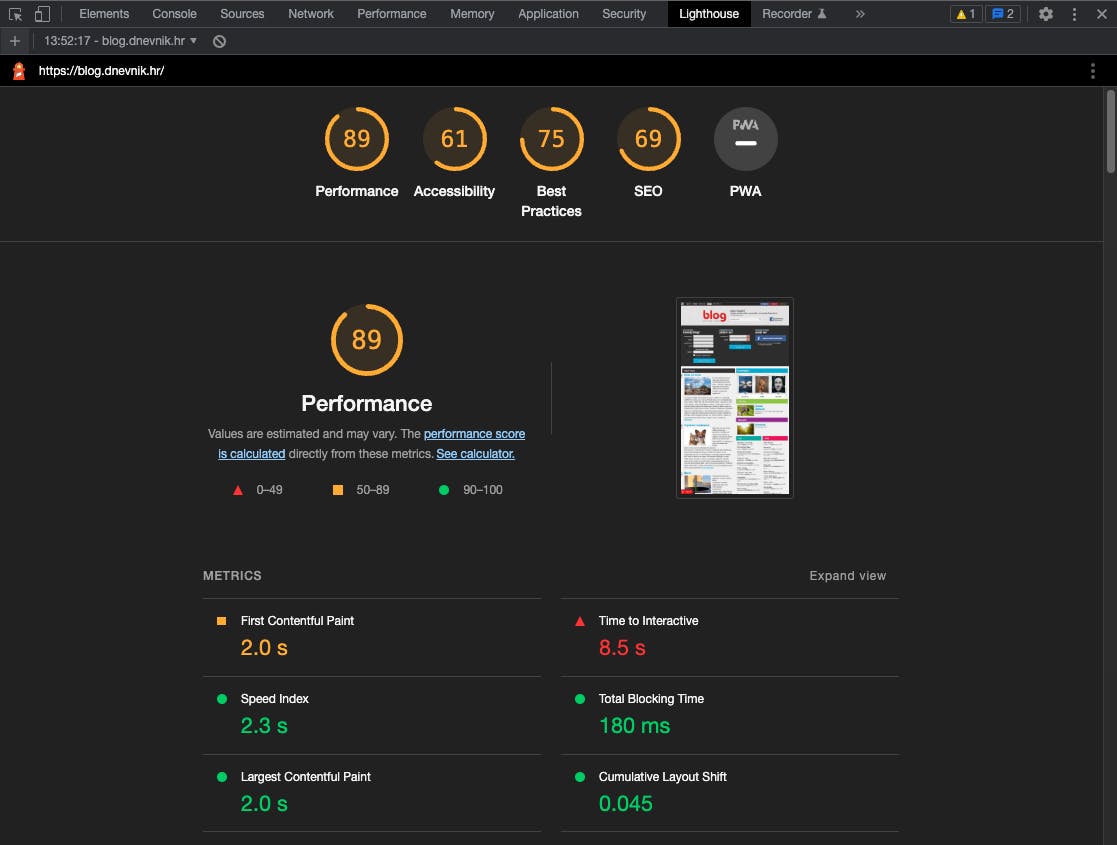
As you can see from the scroll bar, there are many more analyses below.
The screenshot above displays the score for each category in Lighthouse's performance report. While Lighthouse's suggestions for website performance may not be perfect, they are highly valuable because many website owners and developers do not have a clear understanding of the issues or how to solve them. Even as a web developer, I sometimes feel lost when it comes to performance and testing. Thus, Lighthouse is an underutilized and valuable tool for both business owners and developers/sysadmins that is now available as a part of Chrome DevTools.
Wrapping up
The Chrome DevTools is a powerful set of tools that can help web developers to debug, test and optimize their websites. In this article, we explored some lesser-known features of DevTools, including the Design Mode, Network Throttling, Color Picker, Event Monitoring, and Lighthouse performance analysis tool. These features can significantly improve a developer's progress and efficiency.
Although some features are hidden for experimental or practical reasons, knowing where to find them can make a significant difference. The Chrome DevTools team continues to add new features, so it's essential to stay up to date with the latest version to make the most of the browser's debugging and optimization capabilities.
Whether you're an experienced developer or just starting out, exploring DevTools and its features can be a fun and rewarding experience. With the right set of tools and knowledge, you can take your web development skills to the next level and build better, faster, and more reliable websites.
Hey, you! What do you think?
They say knowledge has power only if you pass it on - we hope our blog post gave you valuable insight.
If you want to share your own experience with using Chrome DevTools or want us to help you out with your future coding endeavors, feel free to contact us.
We'd love to hear what you have to say!